
The Footprint2.0 research project aims to build links between environmental science and economics. We are developing data and software interfaces to connect environmental earth observation data with supply chain and econometric models.
One use of this approach is to calculate biodiversity footprints. This figure illustrates how threat hotspots from the IUCN Red List of endangered species can be linked to a global supply chain database in order to allocate threats from primary production to end consumers.
The spatial footprint approach can be generalized to link a many environmental stresses associated with primary production to final consumers. The underlying global supply chain database traces over 5 billion supply chains through 15,000 sectors across 187 countries.
This project finished in 2019. We welcome inquires on future collaboration.In many biodiversity hotspots, export industries drive overexploitation. Successful conservation efforts need to consider the supply chains and consumer demand that ultimately drive resource use.
Spatially explicit biodiversity footprints can connect conservationists, consumers, companies and governments in order to better target conservation actions.
D. Moran, K. Kanemoto. Identifying Species Threat Hotspots from Global Supply Chains Nature Ecology & Evolution, 1(1), 0023, 2017 (Video abstract)This project has been covered in the international press:


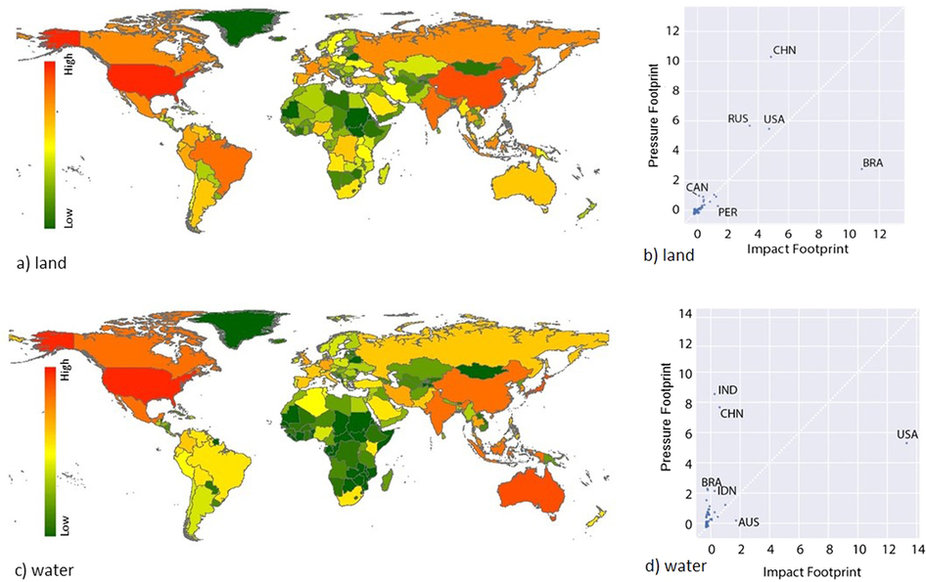
Current footprint assessments typically report on environmental pressures e.g. water use or pollutant emissions, driven by consumption. However, there have been limited attempts to assess the environmental consequences of these pressures. Ultimately, consequences, not pressures, should guide environmental policymaking. The newly released LC-Impact tool offers progress on the path to providing this missing link.
F. Verones, D. Moran, K. Stadler, K. Kanemoto, R. Wood. Resource footprints and their ecosystem consequences Scientific Reports, 7, 40743, 2017.
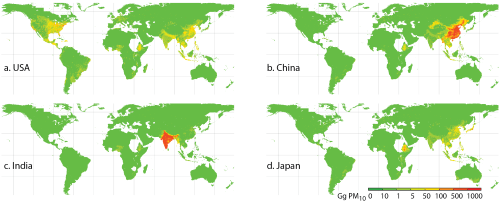
We present a new spatially explicit modeling approach to link SO2, NOx, and PM10 severe emissions hotspots to final consumers via global supply chains. These maps show developed countries reducing their emissions domestically but driving new pollution hotspots in developing countries. This is also the first time a spatially explicit footprint inventory has been established.
D. Moran, K. Kanemoto. Tracing Global Supply Chains to Air Pollution Hotspots Environmental Research Letters, 11(9), 094017Press: Environmental Research Web, ScienceDaily, Phys.Org, EurekAlert

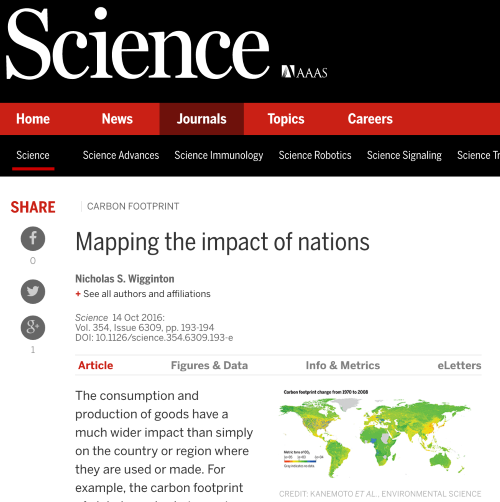
This project connected a spatially explicit map of primary GHG emissions to a classic carbon footprint supply chain database. Allowing businesses and households to see an actual map of where their purchases drive emissions globally can help promote engagement plans, including increased engagement between consumers and upstream suppliers.
K. Kanemoto, D. Moran, E. Hertwich. Mapping the Carbon Footprint of Nations Environmental Science & Technology, 50(19), pp.10512–10517, 2016.Mentioned as an Editors Choice in Science